My Store
Procurement Dashboard
Procurement Dashboard
Couldn't load pickup availability
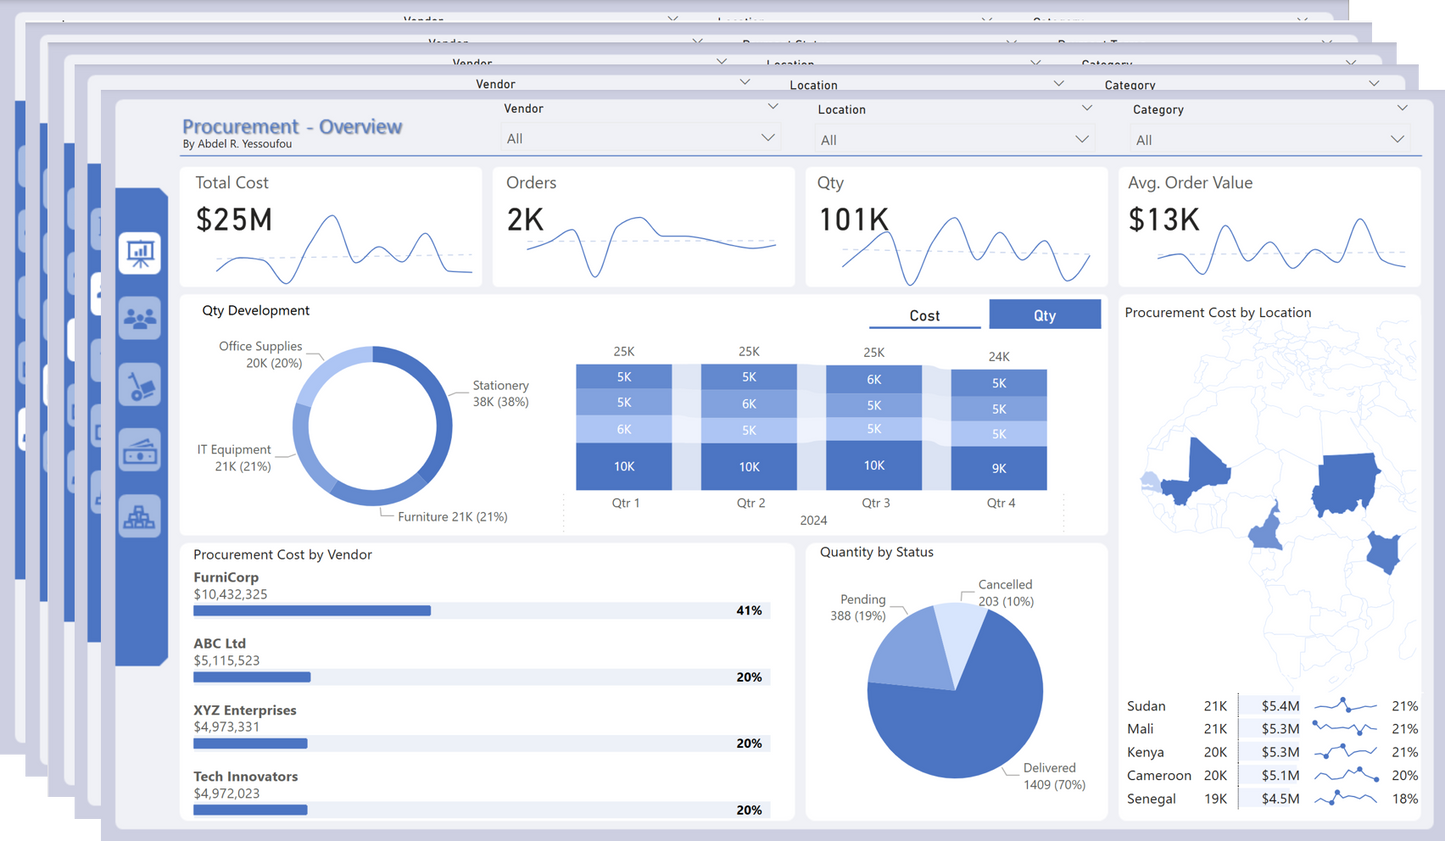
1️⃣ Overview Page
📌 Purpose:
- Provides a high-level summary of key procurement metrics.
- Enables decision-makers to quickly assess procurement performance.
- Highlights trends, top vendors, and key procurement costs.
KPIs & Visuals
✅ Total Procurement Spend (Card)
✅ Total Orders Placed (Card)
✅ Total Quantity Ordered (Card)
✅ Average Order Value (Card)
✅ Order Status Breakdown (Pie Chart: Delivered, Pending, Canceled, Shipped)
✅ Procurement Spend Trend Over Time (Line Chart: Monthly Spend)
✅ Top 5 Vendors by Spend (Bar Chart: Vendor vs. Procurement Cost)
✅ Top 5 Most Purchased Products (Bar Chart: Product vs. Qty Ordered)
Filters/Slicers
🔹 Date Range (Year, Quarter, Month)
🔹 Vendor
🔹 Category
2️⃣ Vendor Performance Page
📌 Purpose:
- Evaluates vendor reliability, delivery performance, and cost contribution.
- Identifies top-performing and low-performing vendors.
KPIs & Visuals
✅ Total Spend per Vendor (Table: Vendor, Total Cost, % of Total Spend)
✅ Orders per Vendor (Bar Chart: Vendor vs. Total Orders)
✅ On-Time Delivery Rate (Gauge or Card)
✅ Average Delivery Lead Time per Vendor (Table: Vendor, Avg. Delivery Days)
✅ Top 5 Vendors by Procurement Spend (Bar Chart)
✅ Vendor Order Fulfillment Rate (Gauge: Delivered Orders % vs. Total Orders)
Filters/Slicers
🔹 Vendor
🔹 Category
🔹 Location
3️⃣ Order Status & Delivery Performance Page
📌 Purpose:
- Analyzes order fulfillment, delays, and delivery performance.
- Helps in identifying logistics inefficiencies.
KPIs & Visuals
✅ Total Orders Delivered On Time (%) (Gauge)
✅ Orders Delayed (%) (Gauge)
✅ Average Delivery Time (Days) (Card)
✅ Pending Orders Count (Card)
✅ Order Status Breakdown (Pie Chart: Pending, Delivered, Shipped)
✅ Orders by Status Over Time (Stacked Column Chart)
✅ Top 5 Most Delayed Vendors (Bar Chart)
✅ Orders by Delivery Time Range (Histogram: <5 Days, 5-10 Days, 10+ Days)
Filters/Slicers
🔹 Order Status
🔹 Vendor
🔹 Location
4️⃣ Payment & Financial Analysis Page
📌 Purpose:
- Monitors payment status, outstanding amounts, and payment terms.
- Helps in tracking financial obligations and budgeting.
KPIs & Visuals
✅ Total Procurement Spend (Card)
✅ Total Amount Paid (Card)
✅ Total Outstanding Payments (Card)
✅ Payment Status Breakdown (Pie Chart: Paid vs. Unpaid)
✅ Payment Terms Distribution (Bar Chart: Net 30, Net 60, Upon Delivery)
✅ Outstanding Payments by Vendor (Table: Vendor, Amount Pending)
✅ Monthly Payment Trend (Line Chart: Paid vs. Unpaid Amounts)
Filters/Slicers
🔹 Payment Status
🔹 Vendor
🔹 Payment Terms
5️⃣ Category & Location-Based Analysis Page
📌 Purpose:
- Provides insights into procurement trends by product category and location.
- Helps in optimizing procurement strategies by region and category.
KPIs & Visuals
✅ Procurement Spend by Category (Bar Chart)
✅ Total Orders by Category (Bar Chart)
✅ Procurement Spend by Location (Map Visual)
✅ Orders by Category & Status (Stacked Column Chart)
✅ Procurement Spend vs. Quantity Ordered by Category (Bubble Chart)
✅ Top 5 Locations by Procurement Spend (Table)
Filters/Slicers
🔹 Category
🔹 Location
Share